How should FCR regulation be done in relation to frequency?
Activation will be linear to the stationary frequency deviation. If linear control is not possible, it can be activated partially linearly (incrementally). Figure A is an example of step-regulated FCR-N, Figure B is an example of step-regulated FCR- up and Figure C is an example of linearly controlled FCR-N.
Figure A is an example of FCR-N from consumption regulated incrementally

The figure is a graph displaying frequency (Hz) on the x-axis and power (%) on the y-axis.
The x-axis ranges in value from 49.90 to 50.10 Hz. The y-axis ranges from -100 to 100. Origo is the point at which the frequency is 50 Hz and the power is 0%. The graph includes a red step-shaped line that runs from a point where the frequency is 49.90 Hz and the power is 100% to a point where the frequency is 50.10 and the power is -100%.
When the frequency is 50 Hz, no power is required (0%). Increasing the frequency from 50.0 Hz to 50.01 Hz changes the power by 10% (incrementally). Increasing the frequency from 50.01 to 50.02 Hz changes the power by an additional 10%. A corresponding ratio occurs when the frequency is decreased.
Note that this is an example, incremental regulation can take place in different ways. For resources with incremental regulation, there is some room for deviation from a proportional response.
The figure also includes a blue bar that encompasses the red step-shaped line. The blue bar shows the interval available for deviating from a proportional response.
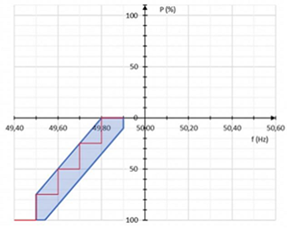
Figure B is an example of FCR-D up from consumption regulated incrementally
The figure is a graph displaying frequency (Hz) on the x-axis and power (%) on the y-axis.
The x-axis ranges in value from 49.40 to 50.60 Hz. The y-axis ranges from -100 to 100. Origo is the point at which the frequency is 50 Hz and the power is 0%. The graph includes a red step-shaped line that runs from a point where the frequency is 49.50 Hz and the power is 100% to a point where the frequency is 49.8 and the power is 0%.
When the frequency is 50 Hz, no power is required (0%). Reducing the frequency from 49.90 Hz to 49.80 Hz changes the power by 25% (incrementally). Reducing the frequency from 49.80 Hz to 49.70 Hz changes the power by a further 25%. A corresponding ratio occurs when the frequency is decreased.
Note that this is an example, incremental regulation can take place in different ways. The figure also includes a blue bar that encompasses the red step-shaped line. The blue bar shows the interval available for deviating from a proportional response.
Figure C shows FCR-N from production that is controlled linearly
The figure is a graph displaying frequency (Hz) on the x-axis and power (%) on the y-axis.
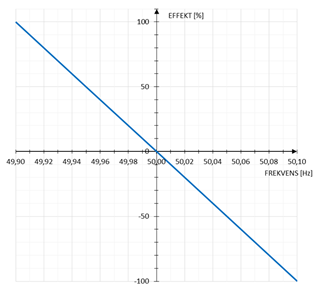
When the frequency is 50 Hz, no power is required (0%). The power changes in exact proportion to a change in frequency (linearly). In continuous (linear) control, activation will take place with a controller whose end value is linear and proportional to the frequency deviation.
The frequency will be measured with sufficient accuracy and resolution and the frequency signal will be used as a parameter for calculating the response setpoint. The setpoint can be calculated by e.g. a PID controller. Another option is a purely proportional regulator that can be combined with a ramp rate limiter or signal processing in the form of, for example, moving averages.
It is up to the provider to design and set up the controller in such a way that requirements such as activation time are met. Svenska kraftnät does not regulate in detail how this should take place, but assesses the suitability of the proposed solution during the prequalification process.